

The 2025-2026
Improve-in-Place Guide
Why homeowners aren’t moving, what drives your home’s equity, and how to avoid the $16k “Hidden Cost” trap.
The Mortgage “Lock-In” Effect
Packing up and moving has become a financial non-starter. With 80% of U.S. mortgages currently below 5%, homeowners are trading their “move-up” dreams for “improve-in-place” realities.
Homeowners are staying put to preserve low rates, driving record renovation volume.
The Generational Renovation Shift
Priorities are shifting across age brackets
The Millennials
- Tech-First: Integrated charging, smart appliances, and app-controlled lighting.
- Efficiency: Focus on energy performance to offset rising utility costs.
- Emergency: Highest per-household spend on maintenance and urgent repairs.
Boomers & Gen X
- Universal Design: Curbless showers, wider doors, and smart bidet seats.
- High Ticket: Large-scale primary suite additions and ADU construction.
- Equity Leverage: Projects often funded via cash or fixed-rate home equity loans.
Financial ROI vs. Daily Joy
Equity Preservation (ROI)
Emotional Value (Joy Score)
The Resilience Frontier
Backup Generators
Grid anxiety has pushed generators into the top 10 ROI list for the first time in industry history.
Heat Pump HVAC
Electrification is a dual-play: immediate energy security and solid long-term value retention.
Universal Design
Universal Design (accessibility) is now a savvy investment for the aging-in-place demographic.
The $16,000 Liability
The “hidden costs” of homeownership have surged 48% over five years. Botched renovations don’t just cost money today; they spike your recurring liability for years.
Average Annual Hidden Cost
Extreme weather has driven a 14.6% increase in HVAC repairs and an 11.5% spike in irrigation costs.
The Change Order Trap
Critical Watchout
Vague Line Items
If it isn’t itemized by the square foot or unit count, it’s a guess. Guesses are where contractors hide future charges.
Contractor Tactic
Low Allowances
Rock-bottom placeholders for tile or fixtures make bids look attractive. You’ll pay the delta halfway through demo.
Legal Liability
Unpermitted Work
Permits protect you, not the city. Skipping them voids your insurance and haunts you at the time of resale.
Contractor Talk Track
“Are these allowances based on our specific design choices, or builder-grade placeholders?”
Force them to define the quality of materials before a single contract is signed.
“Can you show me the last three projects where you stayed within 5% of the original bid?”
A contractor’s history of accuracy is more important than their lowest price.
Negotiate Like a Pro.
Stop gambling with your home equity. Upload your bid to RemodelerIQ for a 100-point audit against gold-standard market data.
Audit Your Bid Now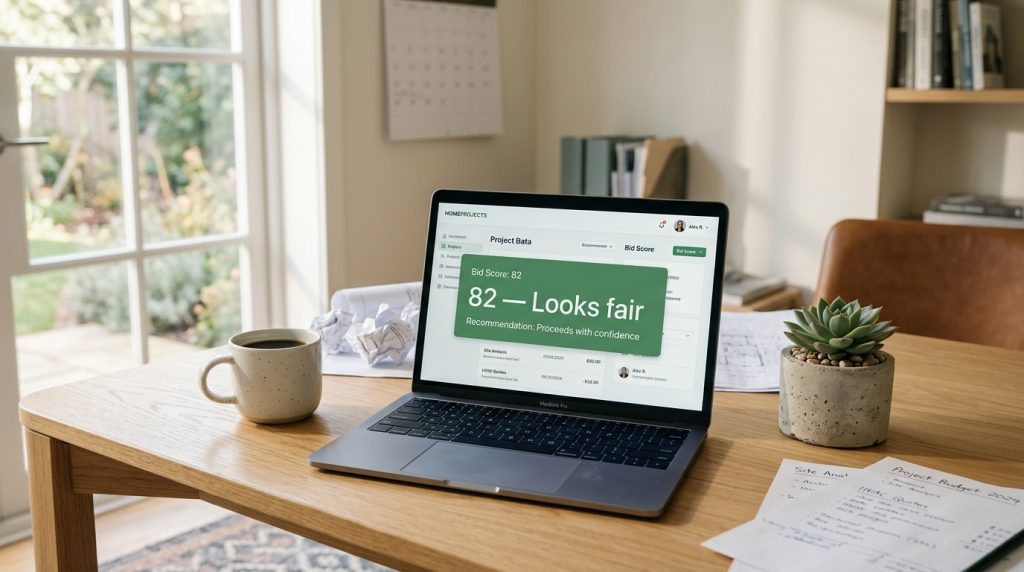





Leave a Reply